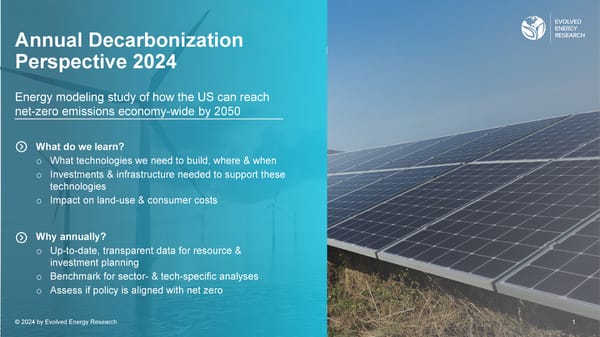
Annual Decarbonization Perspective 2024
This document presents an energy modeling study focusing on how the US can achieve net-zero emissions across the economy by 2050, including necessary technologies and infrastructure.
Annual Decarbonization Perspective 2024 Energy modeling study of how the US can reach net-zero emissions economy-wide by 2050 What do we learn? o What technologies we need to build, where & when o Investments & infrastructure needed to support these technologies o Impact on land-use & consumer costs Why annually? o Up-to-date, transparent data for resource & investment planning o Benchmark for sector- & tech-specific analyses Footer o Assess if policy is aligned with net zero © © 2024 2024 byby E Evvololvved Eed Enernergygy R Resesearearcchh 11
Long-Term Energy Modeling “Plans are useless, but planning is indispensable” – Eisenhower Long-term low emissions pathways illustrate not what will happen, but what could happen, enabling us to identify: • Critical junctures and pivotal societal choices. • Universally beneficial strategies that are robust under different scenarios. • The competitive landscape of technologies, barriers to adoption, and focus areas for research. • Necessary compromises as society, policymakers, and the public come to grips with the realities of transitioning to low-carbon energy. Pathways are a coherent framework for constructing narratives for a transition to a low-carbon energy system © 2024 by Evolved Energy Research 2
Scenarios Evaluate Different Net-Zero Pathways Reference Scenarios Core Scenarios – straight-line to net-zero testing corner strategies Sensitivities – testing singular perturbations Current Slow 100% Central High Central Low Central w Central no Baseline Policy Central Drop-In Low Demand Low Land Consumer Renewables Data Center Biomass Geologic H2 IRA Uptake 6 5 4 e 3 2 O 2 Gt C1 0 -1 -2 4 5 5 4 5 5 4 5 5 4 5 5 4 5 5 4 5 5 4 5 5 4 5 5 4 5 5 4 5 5 4 5 5 4 5 5 02 03 04 02 03 04 02 03 04 02 03 04 02 03 04 02 03 04 02 03 04 02 03 04 02 03 04 02 03 04 02 03 04 02 03 04 2 2 2 2 2 2 2 2 2 2 2 2 2 2 2 2 2 2 2 2 2 2 2 2 2 2 2 2 2 2 2 2 2 2 2 2 F-gases Oil Waste Biomass Geologic Sequestration N2O Natural Gas Industrial Process CO2 Land Sink CH4 Coal Biomass storage Product and Bunkers © 2024 by Evolved Energy Research 3
Best-in-Class Framework for Exploring Long-Term Energy Futures Energy PATHWAYS model used Demand-Side to develop demand-side cases Sectors • Apply fuel switching and energy efficiency levers Residential Commercial Industry Transportation • Strategies vary by end-use (residential space heating to heavy-duty trucks) Regional Investment Supply-side and Operations (RIO Model provides cost-optimal energy supply Electricity Pipeline Gas Refined Solid Fuels combining a comprehensive supply-side capacity Liquid Fuels expansion framework with hourly system operations Hydrogen CCUS Industrial Heat © 2024 by Evolved Energy Research 4
This Year’s ADP Anticipates Surging Electricity Demand 12,000 10,000 Electrolysis ) 8,000 New Data Centers h Buildings & Industry W T ( es6,000 Transportation al S l ai et4,000 R Historical/Baseline 2,000 0 1950 1960 1970 1980 1990 2000 2010 2020 2030 2040 2050 Source: Historical data from EIA Monthly Energy Review, Table 7.6, March 2023. Load growth from ADP 2024 Central Scenario. Note: Electrolysis shows grid-connected electrolysis only, Data Centers and Transportation shows all growth relative to 2024 © 2024 by Evolved Energy Research 5
Impact of Data Centers on Electricity Demand Data Center Capacity Electricity Annual Growth Rates 250 9.0% 8.5% 8.0% 7.4% Historical Net-Zero 200 e7.0% High Growth Sensitivity ad ) c De6.0% W G y 5.1% ( 150 h b t5.0% y t w i o 4.2% r G apac 4.0% C ad 3.0% er 100 Lo3.0% 2.4% ent al 2.0% 2.3% Core ADP Assumption nnu2.0% a C A at 1.0% 0.8% Share of load D 50 0.6% growth from 0.0% data centers 0 2020 2025 2030 2035 2040 2045 2050 Source: Historical data from EIA Monthly Energy Review, Table 7.6, March 2023. Load growth from ADP 2024 Central Scenario. © 2024 by Evolved Energy Research 6
Data Center Location Optimized for Energy Cost Data Centers Before 2030: We assume data center growth H2 Electrolysis will be based on historical built patterns Industrial Boilers Other End-Use Loads After 2030: We explore the impacts of 2024 allowing 50% of data center load growth to locate based on energy cost Result: Both the northern and southern area of the wind belt see high data center growth However, without much spread in clean electricity cost between different places in the wind belt, the best location for this load 2050 growth is uncertain and other factors, not represented here, may predominate. © 2024 Mapbox © OpenStreetMap Source: Historical data center locations from Baxtel: https://baxtel.com/data-center/united-states, 2050 Data From the Central Scenario © 2024 by Evolved Energy Research 7
Data Center Clean Firm Market Share • If data centers procured clean firm resources for their capacity, they would represent a market for up to 55% of clean firm capacity in 2030 and 60% by 2050 (Central – High Data Center) © 2024 by Evolved Energy Research 8
Role of Emerging Technologies in Meeting Demand Potential of 3 cutting-edge technologies o Geologic hydrogen o Next-generation geothermal o LC3 cement Cost breakthroughs needed for net-zero scale deployment of 6 key clean energy technologies o Offshore wind o Solar o Nuclear energy o Geothermal o Gas with carbon capture o Direct air capture Source: ADP 2024 Central Scenario Downscaled Renewables © 2024 by Evolved Energy Research 9
Next-Generation Geothermal 2. Source of Steam for 3. Geothermal Power 1. Long-Term Levelized Cost of Heat from Geothermal Current Policy and Net Zero Across Net Zero Scenarios Current Policy Central 180 4.5 4.0 160 3.5 Constrained Wind 140 3.0 EJ2.5 120 2.0 GW100 1.5 80 1.0 Bubble size represents the 0.5 60 scale of industrial steam 0.0 4 0 5 0 5 0 4 0 5 0 5 0 40 demand at 150°C or less. 02 03 03 04 04 05 02 03 03 04 04 05 2 2 2 2 2 2 2 2 2 2 2 2 Thermal Storage Geothermal Boiler 20 Hydrogen Biomass 0 Heat Pump Pipeline Gas 2024 2030 2035 2040 2045 2050 Dual-fuel Electric Other fossil Levelized Cost of Heat Map produced by Jesse Carney, EER Summery Fellow 2024 © 2024 by Evolved Energy Research 10
Geologic Hydrogen (aka Natural Hydrogen) Geologic H2 a. Hydrogen Production a. CO2 Sources Direct Air Capture Bio-gasification w/CC Gas Power Grid-Connected Electrolysis 12 Biofuels Off-Grid Electrolysis 10 ADP 2024 tests the impact of Cement and Lime SMR w/CC 10 EJ geologic hydrogen in 300 8 2050 available at $1/kg 2 EJ 6 O 200 Captured CO2 is t C used for fuel 4 M synthesis instead of 2 Significantly less electrolysis and 100 sequestration. 0 biofuels are used, saving land area Significant CO2 is equal to the state of Georgia 0 sourced from DAC b. Hydrogen Use b. CO2 Uses Electric Fuels 12 fischer-tropsch liquids Iron and Steel geologic sequestration Other Industry 10 Power Generation 300 Transportation 8 Ammonia Production Additional hydrogen 2 EJ 6 is used for liquid fuel O 200 synthesis and for t C 4 M power generation 100 2 0 0 Central Central w Geologic Central Central w Geologic Hydrogen Hydrogen Geologic hydrogen sensitivity reduces the cost of net-zero by $63B per year in 2050 © 2024 by Evolved Energy Research 11
Limestone Calcined Clay Cement (LC3) Clinker Capacity Share Kiln Heat Demand 2050 Captured CO2 100% ADP 2023 250 272 Central Scenario 80% ear 200 y / t 60% es M l l u a o 150 ot aj 51 Mt T 40% pet of 100 % 20% 50 0% 5 0 5 0 5 0 0 02 03 03 04 04 05 2025 2030 2035 2040 2045 2050 2 2 2 2 2 2 ADP 2024 100% 250 Central Scenario 80% ear 200 197 y / t 60% es M l l u a o 150 ot aj T 40% pet 24 Mt of 100 LC3 % 20% Direct Separation w/CC Retrofit 50 Oxyfuel Biomass w/CC 0% Oxyfuel Gas w/CC 4 0 5 0 5 0 0 Conventional 02 03 03 04 04 05 2024 2030 2035 2040 2045 2050 2 2 2 2 2 2 © 2024 by Evolved Energy Research 12
Cost Breakthroughs for Net-Zero Scale Deployment $70 150 GW 250 GW 150 GW 150 Mt/yr $60 $160 150 GW $50 $140 h $120 W$40 1900 GW M / D $100 S onne T $30 / D $80 2022 U S $20 Cost Target – Net Zero Policy 2022 U$60 $40 $10 Cost Target – Current Policy $20 $0 $0 Transmission-Sited Solar Next Generation Nuclear Offshore Wind Next Generation Gas with Carbon Capture Solid Sorbant PV Geothermal Direct Air Capture © 2024 by Evolved Energy Research 13
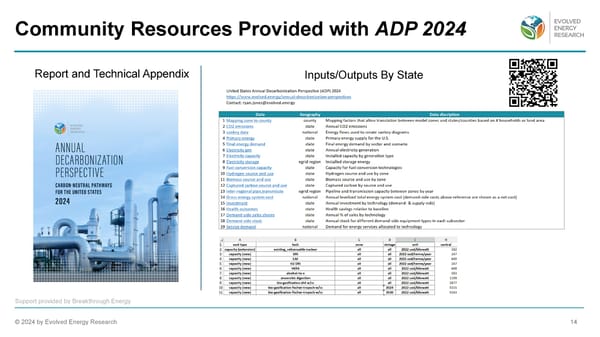
Community Resources Provided with ADP 2024 Report and Technical Appendix Inputs/Outputs By State Support provided by Breakthrough Energy © 2024 by Evolved Energy Research 14

