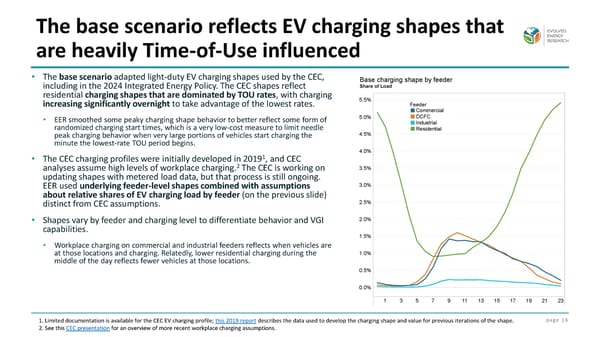
page 16 • The base scenario adapted light-duty EV charging shapes used by the CEC, including in the 2024 Integrated Energy Policy. The CEC shapes reflect residential charging shapes that are dominated by TOU rates, with charging increasing significantly overnight to take advantage of the lowest rates. • EER smoothed some peaky charging shape behavior to better reflect some form of randomized charging start times, which is a very low-cost measure to limit needle peak charging behavior when very large portions of vehicles start charging the minute the lowest-rate TOU period begins. • The CEC charging profiles were initially developed in 20191, and CEC analyses assume high levels of workplace charging.2 The CEC is working on updating shapes with metered load data, but that process is still ongoing. EER used underlying feeder-level shapes combined with assumptions about relative shares of EV charging load by feeder (on the previous slide) distinct from CEC assumptions. • Shapes vary by feeder and charging level to differentiate behavior and VGI capabilities. • Workplace charging on commercial and industrial feeders reflects when vehicles are at those locations and charging. Relatedly, lower residential charging during the middle of the day reflects fewer vehicles at those locations. The base scenario reflects EV charging shapes that are heavily Time-of-Use influenced 1. Limited documentation is available for the CEC EV charging profile; this 2019 report describes the data used to develop the charging shape and value for previous iterations of the shape. 2. See this CEC presentation for an overview of more recent workplace charging assumptions.
 Exploring the Value of Vehicle to Grid (V2G) for California Page 15 Page 17