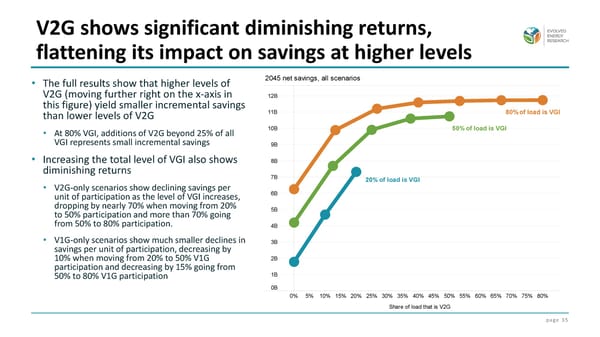
page 35 • The full results show that higher levels of V2G (moving further right on the x-axis in this figure) yield smaller incremental savings than lower levels of V2G • At 80% VGI, additions of V2G beyond 25% of all VGI represents small incremental savings • Increasing the total level of VGI also shows diminishing returns • V2G-only scenarios show declining savings per unit of participation as the level of VGI increases, dropping by nearly 70% when moving from 20% to 50% participation and more than 70% going from 50% to 80% participation. • V1G-only scenarios show much smaller declines in savings per unit of participation, decreasing by 10% when moving from 20% to 50% V1G participation and decreasing by 15% going from 50% to 80% V1G participation V2G shows significant diminishing returns, flattening its impact on savings at higher levels
 Exploring the Value of Vehicle to Grid (V2G) for California Page 34 Page 36