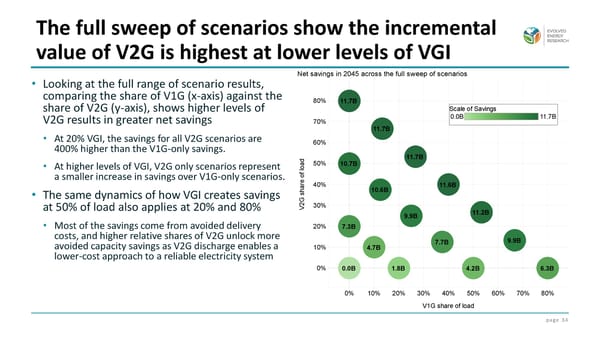
page 34 • Looking at the full range of scenario results, comparing the share of V1G (x-axis) against the share of V2G (y-axis), shows higher levels of V2G results in greater net savings • At 20% VGI, the savings for all V2G scenarios are 400% higher than the V1G-only savings. • At higher levels of VGI, V2G only scenarios represent a smaller increase in savings over V1G-only scenarios. • The same dynamics of how VGI creates savings at 50% of load also applies at 20% and 80% • Most of the savings come from avoided delivery costs, and higher relative shares of V2G unlock more avoided capacity savings as V2G discharge enables a lower-cost approach to a reliable electricity system The full sweep of scenarios show the incremental value of V2G is highest at lower levels of VGI
 Exploring the Value of Vehicle to Grid (V2G) for California Page 33 Page 35