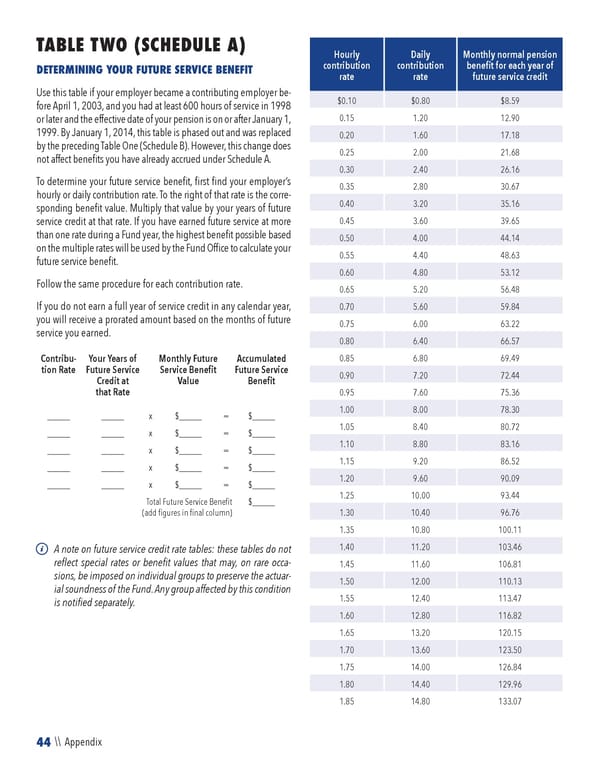
44 \\ Appendix TABLE TWO (SCHEDULE A) DETERMINING YOUR FUTURE SERVICE BENEFIT Use this table if your employer became a contributing employer be- fore April 1, 2003, and you had at least 600 hours of service in 1998 or later and the effective date of your pension is on or after January 1, 1999. By January 1, 2014, this table is phased out and was replaced by the preceding Table One (Schedule B). However, this change does not affect benefits you have already accrued under Schedule A. To determine your future service benefit, first find your employer’s hourly or daily contribution rate. To the right of that rate is the corre- sponding benefit value. Multiply that value by your years of future service credit at that rate. If you have earned future service at more than one rate during a Fund year, the highest benefit possible based on the multiple rates will be used by the Fund Office to calculate your future service benefit. Follow the same procedure for each contribution rate. If you do not earn a full year of service credit in any calendar year, you will receive a prorated amount based on the months of future service you earned. Contribu- tion Rate Your Years of Future Service Credit at that Rate Monthly Future Service Benefit Value Accumulated Future Service Benefit _____ _____ x $_____ = $_____ _____ _____ x $_____ = $_____ _____ _____ x $_____ = $_____ _____ _____ x $_____ = $_____ _____ _____ x $_____ = $_____ Total Future Service Benefit (add figures in final column) $_____ A note on future service credit rate tables: these tables do not reflect special rates or benefit values that may, on rare occa- sions, be imposed on individual groups to preserve the actuar- ial soundness of the Fund. Any group affected by this condition is notified separately. Hourly contribution rate Daily contribution rate Monthly normal pension benefit for each year of future service credit $0.10 $0.80 $8.59 0.15 1.20 12.90 0.20 1.60 17.18 0.25 2.00 21.68 0.30 2.40 26.16 0.35 2.80 30.67 0.40 3.20 35.16 0.45 3.60 39.65 0.50 4.00 44.14 0.55 4.40 48.63 0.60 4.80 53.12 0.65 5.20 56.48 0.70 5.60 59.84 0.75 6.00 63.22 0.80 6.40 66.57 0.85 6.80 69.49 0.90 7.20 72.44 0.95 7.60 75.36 1.00 8.00 78.30 1.05 8.40 80.72 1.10 8.80 83.16 1.15 9.20 86.52 1.20 9.60 90.09 1.25 10.00 93.44 1.30 10.40 96.76 1.35 10.80 100.11 1.40 11.20 103.46 1.45 11.60 106.81 1.50 12.00 110.13 1.55 12.40 113.47 1.60 12.80 116.82 1.65 13.20 120.15 1.70 13.60 123.50 1.75 14.00 126.84 1.80 14.40 129.96 1.85 14.80 133.07
 2023 NPF Summary Plan Description Page 45 Page 47